Biology • Year 12 • Module 7 • Lesson 12
T Cells and Cell-Mediated Immunity
Apply cell-mediated immunity to real CD4+ count data, a cause-and-effect chain, a flawed student diagram, and a perturbation scenario set in an Australian context.
1. Interpret CD4+ T cell count data over untreated HIV infection
The graph below is adapted from the natural history of untreated HIV infection, showing mean CD4+ T cell count (cells per µL) and plasma viral load (copies/mL) over approximately 11 years. The dashed horizontal line at 200 cells/µL represents the threshold below which AIDS is diagnosed. 8 marks
Adapted from Fauci & Lane, in Harrison’s Principles of Internal Medicine. Illustrative of natural-history data.
1.1 Describe the trend in CD4+ T cell count from Year 0 to Year 11. Use figures from the graph in your answer. 2 marks
1.2 Using your understanding of T helper cell function, explain why the viral load rises steeply at Year 9–11, at the same time as CD4+ count falls below 200. 3 marks
1.3 Modern antiretroviral therapy (ART) can suppress viral replication to undetectable levels in patients with HIV. Predict what would happen to CD4+ T cell count if ART successfully eliminated viral replication at Year 5. Justify your prediction using lesson content. 3 marks
2. Cause-and-effect chain, HIV attacking the CD4+ T helper cell
Complete the effect boxes to trace the consequence of HIV destroying CD4+ T helper cells on each arm of adaptive immunity. 6 marks (1 per correctly completed box + 1 for the overall outcome)
| Cause | → | Effect (complete this) |
|---|---|---|
| HIV gp120 protein binds to the CD4 receptor on T helper cells | → |
|
| T helper cells are destroyed; co-stimulatory signals to B cells cease | → |
|
| IL-2 from T helper cells is no longer released to cytotoxic T cells | → |
|
| Without CTL expansion, virus-infected host cells are not eliminated | → |
|
| T helper cytokines that activate macrophages are absent | → |
|
| Overall outcome (so…) | → |
|
3. Diagram critique, what’s wrong with this student’s diagram?
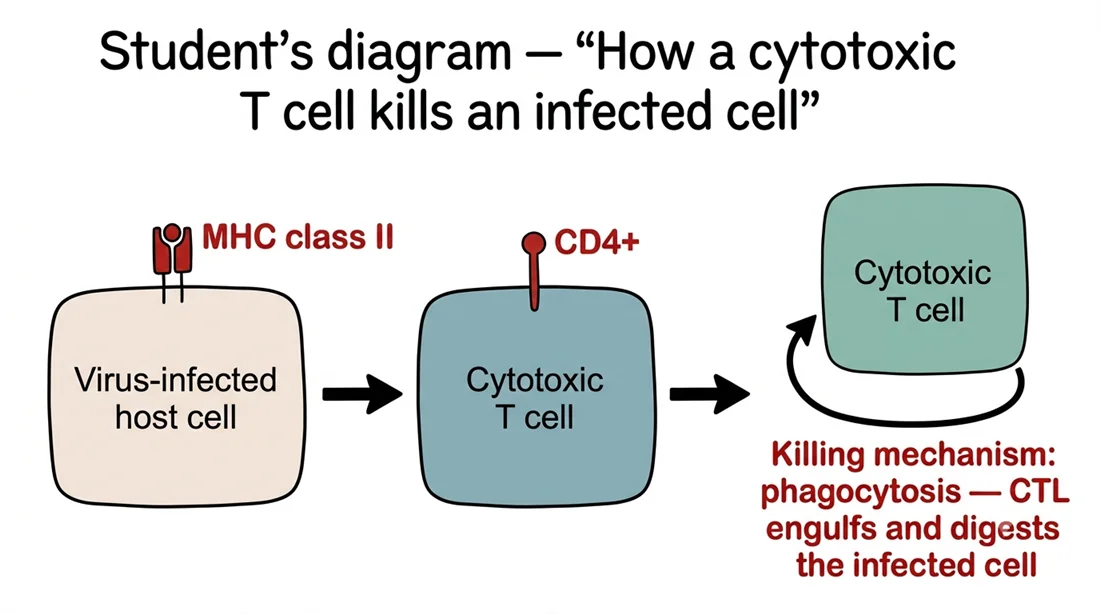
A Year 12 student has drawn the diagram below to explain how a cytotoxic T cell kills an infected cell. There are three biological errors in the diagram. Identify each error and write the correction. 6 marks (2 per error: 1 identify, 1 correct)
3.1 Error 1: What is wrong?
Correction:
3.2 Error 2: What is wrong?
Correction:
3.3 Error 3: What is wrong?
Correction:
4. Apply to a new scenario, organ transplant rejection in Australia
In Australia, kidney transplant recipients are given immunosuppressive drugs (e.g. cyclosporin) that inhibit IL-2 production by T helper cells. Without this treatment, transplant rejection occurs rapidly. 5 marks
4.1 Explain why suppressing IL-2 production reduces the risk of transplant rejection. In your answer, refer to the role of IL-2 in activating cytotoxic T cells. 3 marks
4.2 Explain why immunosuppressive treatment also increases the patient’s susceptibility to opportunistic infections such as Pneumocystis jirovecii pneumonia. 2 marks
Q1.1, CD4+ trend description (2 marks)
CD4+ T cell count begins at approximately 1000 cells/µL at infection. It dips briefly during the acute phase (to ~700), partially recovers to ~800–820 by Year 1, then declines progressively through the chronic phase, reaching ~600 by Year 3, ~480 by Year 5, and falling below the AIDS threshold of 200 by Year 9, continuing to decline to approximately 120 by Year 11. Overall the trend is a sustained progressive decline across 11 years [1 mark for describing the overall decline; 1 mark for quoting at least two supporting data points].
Q1.2, Viral load rise linked to CD4+ collapse (3 marks)
T helper cells (CD4+) provide the co-stimulatory signals required for full B cell activation and antibody production [1 mark]. They also provide IL-2 that drives clonal expansion of cytotoxic T cells, which kill virus-infected host cells [1 mark]. When CD4+ count falls below 200, both the antibody response and the cytotoxic T cell response are severely impaired, the virus can replicate in infected cells without being cleared, and new virions spread without neutralising antibody; hence viral load rises steeply [1 mark].
Q1.3, Prediction: ART at Year 5 (3 marks)
If viral replication is suppressed at Year 5, the rate of CD4+ T helper cell destruction would slow markedly because HIV cannot infect and kill new T helper cells without replicating [1 mark]. The existing CD4+ count (~480 cells/µL at Year 5) would stabilise and, over time, the immune system can partially reconstitute, CD4+ counts typically recover toward normal range in patients on long-term ART [1 mark]. The consequence for immunity would be partial restoration of both humoral and cell-mediated immune coordination, reducing susceptibility to opportunistic infections [1 mark]. Accept also: count stabilises at ~480 and may improve as the existing T helper cells are no longer being destroyed.
Q2, Cause-and-effect chain (6 marks)
Row 1: HIV enters and destroys T helper cells / CD4+ count progressively declines.
Row 2: B cells cannot receive the co-stimulatory signal needed for full activation; antibody class switching to IgG is impaired; antibody responses weaken.
Row 3: Cytotoxic T cells cannot proliferate (clonal expansion fails); the CTL killing response is insufficient to clear virus-infected host cells.
Row 4: Virus-infected cells continue to produce new virions; viral load rises; infection spreads within the body.
Row 5: Macrophages are less effectively activated; phagocytic clearance of pathogens and debris declines.
Overall outcome: Both arms of adaptive immunity are impaired simultaneously; the patient becomes susceptible to opportunistic pathogens (e.g. Pneumocystis jirovecii, Toxoplasma gondii) that a healthy immune system clears routinely, clinical AIDS.
Q3, Diagram critique (6 marks)
3.1 Error 1 (MHC class II on infected body cell): Infected body cells display antigen on MHC class I, not class II. MHC class II is found only on professional antigen-presenting cells (dendritic cells, macrophages, B cells). Correction: label the infected cell as displaying antigen on MHC class I. [1 + 1]
3.2 Error 2 (CTL labelled CD4+): Cytotoxic T cells carry the CD8 surface marker, not CD4. CD4+ is the marker on T helper cells. Correction: relabel the cytotoxic T cell as CD8+. [1 + 1]
3.3 Error 3 (killing via phagocytosis): Cytotoxic T cells do not engulf infected cells by phagocytosis. Phagocytosis is performed by macrophages and neutrophils. Correction: CTLs kill target cells by releasing perforin (which forms pores in the target cell membrane) and granzymes (which enter through the pores and trigger apoptosis, programmed cell death). [1 + 1]
Q4.1, Why suppressing IL-2 reduces rejection (3 marks)
The transplanted kidney contains cells expressing foreign MHC molecules, which cytotoxic T cells (CD8+) would normally recognise as non-self on MHC class I and target for destruction [1 mark]. Full activation and clonal expansion of these cytotoxic T cells requires IL-2 from T helper cells [1 mark]. Cyclosporin inhibits IL-2 production, so CTLs cannot proliferate into a large clone army of killers, and the transplanted tissue is not destroyed [1 mark].
Q4.2, Why susceptibility to infection increases (2 marks)
Because IL-2 is suppressed, cytotoxic T cells cannot mount effective killing responses against virus-infected host cells [1 mark]. Additionally, T helper cell signalling is impaired, weakening both the antibody response (B cell activation) and the macrophage response, leaving the patient unable to clear normally manageable pathogens such as Pneumocystis jirovecii, which causes pneumonia only in immunocompromised individuals [1 mark].