Herd Immunity and Vaccination Coverage
You'll be able to evaluate how high vaccination coverage shields vulnerable people, using measles and influenza as examples.
Imagine a school where measles vaccination coverage falls from 95% to 80%. Explore why this could increase outbreak risk, why vaccination coverage is not the same as immunity, and how high immunity can help protect vulnerable people.
Printable Worksheets
Print or save as PDF, or build a custom worksheet from any module's questions.
Q1 · How can a disease stop spreading in a community even when not every person is vaccinated?
Q2 · A school has 95% vaccination coverage for measles. Predict what might happen if coverage dropped to 80% after a social media campaign discouraging vaccines.
● Know
- Define herd immunity and the herd immunity threshold
● Understand
- Explain how R0 determines a simplified immune threshold and why vaccination coverage also depends on vaccine protection and contact patterns
● Can do
- Evaluate how high vaccination coverage shields vulnerable people, using measles and influenza as examples
In 2020, the world watched public health authorities report two very different numbers for COVID-19: an early case fatality rate above 3% in Italy, and under 0.5% in South Korea, the same disease, seemingly different danger. The difference came from how many cases were being detected, not how deadly the virus was. Three key statistics let epidemiologists make sense of exactly this kind of data. Case fatality rate (CFR) tells us how deadly a disease is: it is the percentage of people diagnosed with a disease who die from it. Vaccine efficacy tells us how well a vaccine works in trials. Incidence rate tells us how fast a disease is spreading in a population, adjusted for population size.
Always check the context behind the numbers. A raw case count of 50 might represent a crisis in a village of 500 but a blip in a city of 5 million. A case fatality rate of 5% might be terrifying for Ebola but actually quite low for rabies. Numbers are tools, not truths, they only become meaningful when you know what they measure, who they include, and what they leave out.
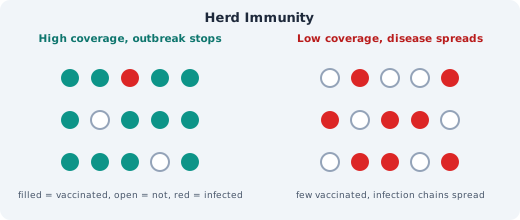
Reading the diagram: This schematic shows one possible transmission outcome, not a guaranteed result or a measles threshold. It assumes vaccinated people are fully immune and the illustrated contacts interrupt spread. Real vaccine protection and contact patterns vary; high coverage does not guarantee that an outbreak stops.
Text description
- High coverage: 12 of 15 people vaccinated, 2 not vaccinated, 1 infected; the infection has nowhere to go, so the outbreak stops.
- Low coverage: only 3 of 15 vaccinated, 4 not vaccinated and 8 infected; infection chains spread.
A disease outbreak causes 50 deaths out of 1,000 confirmed cases. The case fatality rate is (50 / 1000) x 100 = 5%. This means 5% of people diagnosed with this disease die from it. It does not mean 5% of the entire population will die.
The Australian Bureau of Statistics and AIHW publish disease statistics using standardised rates per 100,000 population, allowing fair comparison between states and between Australia and other countries.
A depth study is your opportunity to think and work like a real scientist. The process begins with curiosity: what disease-related question genuinely interests you? From there, you narrow it down to an investigable question one that is specific enough to answer, testable through measurement or observation, and linked to the scientific concepts you have studied in this unit.
Next, you develop a hypothesis, design a fair method with clear variables, collect reliable data, analyse it with appropriate graphs and statistics, and draw conclusions that honestly evaluate whether your evidence supports your hypothesis. The best depth studies do not just confirm what the textbook says; they explore something new, even if the result is unexpected. Science advances through unexpected results.
A student interested in herd immunity might start with Does clustering matter? and refine it to Does clustering the same number of immune people change the number of new model infections over ten contact rounds? This is specific (distribution of immunity), testable using a fictional paper or computer simulation, and linked to transmission. Hold the total immune number and contact rules constant; do not expose people or culture microorganisms.
The Science Teachers Association of NSW runs the Young Scientist Awards, celebrating depth studies from students statewide. Winners often go on to represent Australia at international science fairs.
Herd immunity is the protection of a whole community when enough people are immune to a disease that it cannot spread easily. The threshold, the percentage of people who need to be immune, depends on how contagious the disease is.
The formula: Herd immunity threshold ≈ 1 − 1/R₀. This is an immune fraction in a simple model with equal mixing and lasting, complete immunity. At the threshold, average onward transmission is one; above it, the average is below one. Neither result guarantees that no infections occur.
Where R₀ (the basic reproduction number) is the average number of people one infected person infects in a fully susceptible population.
Examples:
- Measles: R₀ ≈ 15 → threshold ≈ 1 − 1/15 = 0.933, or about 93%.
- Polio: R₀ ≈ 5 → threshold ≈ 1 − 1/5 = 0.80, or about 80%.
- Influenza: R₀ ≈ 2 → threshold ≈ 1 − 1/2 = 0.50, or about 50%.
Vaccination coverage is the proportion vaccinated, not necessarily the proportion effectively immune: protection can be incomplete or wane. Outbreak risk depends on immunity, contact patterns and introduction of the pathogen. Clusters of susceptible people can permit local spread even when overall coverage is high.
In 2019, Samoa experienced a devastating measles outbreak that killed 83 people, mostly children. The outbreak occurred because vaccination coverage had fallen to about 31% after a tragic incident in 2018 where two infants died from a vaccine preparation error (nurses mixed the vaccine with anaesthetic instead of saline). This caused widespread vaccine hesitancy, and coverage plummeted. When measles was introduced, it spread rapidly through the unvaccinated population. The outbreak ended only after an emergency vaccination campaign reached over 90% coverage. This tragedy illustrates the importance of maintaining protection against highly contagious diseases. Lower coverage can increase outbreak risk, but a coverage percentage alone does not guarantee or precisely predict an outbreak.
Australian vaccination coverage: The National Centre for Immunisation Research and Surveillance (NCIRS) monitors childhood vaccination coverage across Australia. Full-schedule coverage and measles-specific effective immunity are different measures, so a full-schedule percentage cannot simply be compared with the model measles immune threshold. However, pockets of lower coverage exist, particularly in some affluent areas where vaccine hesitancy is higher. In 2019, several measles outbreaks occurred in Australia linked to imported cases in under-vaccinated communities. The Australian Immunisation Register tracks every vaccination, enabling public health officials to identify areas at risk and target interventions. Maintaining >95% coverage for measles-mumps-rubella (MMR) vaccine is essential for keeping measles eliminated in Australia.
Use R0 = 15 in a simple measles model. Suppose 85% are vaccinated, every vaccinated person has complete immunity, nobody else is immune, and people mix equally. The model immune threshold is about 93.3%. Predict whether sustained transmission is possible if a case is introduced, and explain why an outbreak is not certain.
How close was your prediction?
Nice calibration, your intuition is good for this kind of problem.
Good, being surprised is the point. This answer is worth remembering.
Wrong: "A depth study is just a long essay about a disease." No, a depth study is an investigation. It requires you to ask a question, gather evidence, analyse data, and draw conclusions. It is active science, not just research.
Right: A depth study is an active scientific investigation that requires asking a question, gathering evidence, analysing data, and drawing conclusions, it is not simply a research essay.
Wrong: "The different topics in this unit have no connection to each other." No, they are deeply connected. Pathogens cause disease, which the immune system fights, which vaccines train, which antibiotics treat, which resistance limits, which public health prevents. Every topic links to others.
Right: Every topic in this unit is connected, pathogens cause disease, the immune system fights infection, vaccines train immunity, antibiotics treat bacteria, and resistance drives public health strategies.
Wrong: "Once you memorise facts about disease, you understand it." No, true understanding means being able to explain connections, apply concepts to new situations, and evaluate evidence. Facts are tools; understanding is the ability to use them.
Right: True understanding means explaining connections between concepts, applying knowledge to new situations, and evaluating evidence, not just recalling isolated facts.
Australian Scientists Fighting Disease
Professor Fiona Stanley (AC): An Australian epidemiologist who founded the Telethon Kids Institute in Perth. Her research on birth defects, Indigenous health, and population health methods transformed Australian public health. She championed the use of population data to guide health policy.
Professor Ian Frazer: Co-developer of the HPV vaccine at the University of Queensland. His work has prevented countless cases of cervical cancer worldwide and put Australia on track to eliminate cervical cancer entirely.
Modern Australian research: Today, Australian scientists at WEHI, the Doherty Institute, CSIRO, and universities across the country continue to fight disease. During COVID-19, Australian researchers contributed to vaccine development, genomic surveillance, and long COVID research. Aboriginal and Torres Strait Islander researchers are increasingly leading health research that addresses community priorities with cultural authority.
✍ Copy Into Your Books
▾Unit Connections
- Pathogen -> Transmission -> Defence -> Treatment
- Infectious vs non-infectious disease
- Local, national, and global perspectives
Key Formulas
- Herd immunity threshold ≈ 1 - 1/R0
- Incidence rate = (new cases/population) × multiplier
- Case fatality rate = (deaths/cases) × 100%
Depth Study Steps
- Choose topic -> Formulate question -> Research -> Hypothesis -> Method -> Data collection -> Analysis -> Conclusions -> Communication
Explain Herd Immunity with a Model
Plan a Safe Coverage Simulation
At the start of this lesson, you considered a fictional school where measles vaccination coverage fell from 95% to 80%. Explain how this could change transmission risk and why coverage alone cannot tell us exactly how many people are immune.
Now that you've worked through the lesson, can you explain how high immunity reduces transmission and why protection is not absolute? Has your view of your own role in community health changed?
Q1. Define herd immunity and explain what is meant by the herd immunity threshold. 2 marks
Q2. Influenza has an R0 of about 2, while measles has an R0 of about 15. Using the formula threshold ≈ 1 minus 1/R0, calculate the model immune threshold for each and explain why measles needs a much higher immune proportion. Assume equal mixing and complete, lasting immunity. 3 marks
Q3. A baby too young for a particular vaccine lives in a community with 95% coverage for that vaccine. Explain how high coverage can reduce the baby’s exposure and why 95% vaccinated does not necessarily mean 95% immune. Evaluate how a large fall in coverage could affect the baby’s risk if the pathogen is introduced. 3 marks
Revisit Your Thinking
Go back to your Think First answer. Has your understanding changed?
- How has your understanding of disease and health developed across this entire unit?
- What connections between concepts do you find most powerful or surprising?
Model answers (click to reveal)
Answers
▾MCQ 1
C Herd immunity is the protection of a whole community that happens when enough people are immune that the disease cannot spread easily. It does not require every person to be vaccinated.
MCQ 2
A Using 1 minus 1/R0 with R0 = 15 gives 1 minus 1/15 = 0.933, or about 93%. This is the model immune threshold, not a direct measurement of vaccination coverage. At the threshold, average onward transmission is one; a higher immune proportion brings it below one under the stated assumptions.
MCQ 3
D When more contacts are immune, transmission chains are more likely to be interrupted, reducing exposure for vulnerable people. This is indirect protection, not a guarantee that infection cannot reach them. Vaccine suitability depends on the particular vaccine and the person’s circumstances.
MCQ 4
B The basic reproduction number (R0) is the average number of people one infected person infects in a fully susceptible population. A higher R0 means a more contagious disease and a higher herd immunity threshold.
MCQ 5
A A fall from 95% to 80% vaccination coverage can leave more susceptible students, increasing outbreak risk if measles is introduced. Coverage alone does not tell us the exact immune proportion, and an outbreak is not inevitable; protection and contact patterns also matter.
Short Answer 1
Model answer: Herd immunity is indirect protection that occurs when immune people reduce transmission, making susceptible people less likely to be exposed. In a simple equal-mixing model with complete, lasting immunity, the threshold is the immune proportion that brings average onward transmission to one; above it, the average is below one. This reduces the opportunity for sustained spread but does not mean infection cannot reach a non-immune person. Vaccination coverage and effective immunity are not necessarily the same.
Short Answer 2
Model answer: For influenza, threshold ≈ 1 minus 1/2 = 0.5, or about 50%. For measles, threshold ≈ 1 minus 1/15 = 0.933, or about 93.3%. A higher R0 means more secondary infections per case in a fully susceptible population, so measles requires a larger immune proportion to bring average onward transmission to one in this model. A proportion above the threshold brings the average below one. These are immune fractions under the stated assumptions; actual vaccination coverage requirements also depend on vaccine protection and contact patterns.
Short Answer 3
Model answer: High vaccination coverage can reduce transmission around the baby, making exposure less likely and providing indirect protection. However, 95% vaccinated does not necessarily mean 95% immune, because vaccine protection may be incomplete or wane. It does not guarantee that the baby cannot become infected. A large fall in coverage can leave more susceptible contacts and increase the chance of transmission reaching the baby if the pathogen is introduced. The outcome also depends on the disease, contact patterns and other sources of immunity; the coverage number alone cannot predict an individual baby’s protection.
Activity 1: Explain Herd Immunity with a Model
- R₀ = 2 gives 50%; R₀ = 5 gives 80%; R₀ = 15 gives 93.3% (to one decimal place). A pathogen with a larger R₀ has more opportunities to spread in a susceptible population, so a larger immune proportion is required to bring average onward transmission to one at the threshold; a proportion above it brings the average below one in this simple model. These are model immune fractions, not guarantees or direct estimates of vaccination coverage with an imperfect vaccine.
- When more contacts are immune, fewer contacts become infected and pass the pathogen on, so chains of transmission are interrupted and a susceptible person is less likely to be exposed. This is indirect protection. It does not give that person their own immunity and does not guarantee that infection is impossible.
- A (95%) is above 93.3%; B (80%) is below it. Under the stated model, B permits sustained transmission more readily, but an outbreak is not inevitable: a pathogen must be introduced and transmission events are not guaranteed. Vaccination coverage is the proportion vaccinated, whereas effective immunity depends on how well protection works and lasts. The simple threshold assumes full protection and equal mixing; real populations can differ.
Activity 2: Plan a Safe Coverage Simulation
- There are 170 immune people out of 200, so the combined proportion is 85%. X is 95%, above 80%; Y is 75%, below 80%. The combined 85% can conceal a cluster with more susceptible people. If contacts occur mainly within neighbourhoods, the equal-mixing assumption for the combined population is inappropriate; the same overall percentage need not give uniform protection.
- For example: How does clustering the same 170 immune people affect the number of new model infections after a fixed number of contact rounds? Predict more local spread in the less-protected neighbourhood, provided contacts are mainly local. Change the distribution of immunity (85/85 versus 95/75), not the total immune number. Measure new infections after the same number of rounds. Keep population size, total immunity, contact rules, transmission rule, starting introduction and number of rounds the same. Credit another clearly specified, fair model comparison and a justified prediction.
- Use labelled counters or computer nodes for 200 fictional people; assign immune status according to each arrangement. Apply a stated contact/transmission rule for a fixed number of rounds, with the same rules in both arrangements. Record new infections per run in a table with arrangement, run and outcome headings. Repeat with varied random contact sequences under the same rules and compare the distribution or average of outcomes; a single run may be unusual. Limits include oversimplified contact patterns, assumed complete lasting immunity, assumed transmission probability and omission of behaviour changes. A model is evidence about its assumptions, not a prediction of exactly who will become ill. No real health data or exposure experiment is needed.