Investigating Outbreaks: Epidemiology
In 2019, NSW Health traced a measles outbreak in western Sydney to a single unvaccinated international traveller, using 3 separate data streams (vaccination records, hospital admissions, and contact-tracing maps) to stop transmission within 2 weeks.
Printable Worksheets
Print or save as PDF, or build a custom worksheet from any module's questions.
How are vaccination, antibiotics, and handwashing connected in preventing disease?
Why does a small drop in vaccination coverage sometimes cause large disease outbreaks?
● Know
- Define epidemiology and key terms such as outbreak, case, and incidence
- Identify the data streams epidemiologists use to track an outbreak
- Describe how contact tracing follows a pathogen through a population
● Understand
- Explain how multiple data streams are combined to locate an outbreak source
- Interpret case and incidence data to judge whether an outbreak is growing or slowing
- Connect the 2019 Sydney measles outbreak to the wider science of disease tracing
● Can do
- Trace an outbreak from index case to contacts using a simple data set
- Read and analyse incidence graphs to describe outbreak trends
- Evaluate how a public health response stopped transmission
The Disease unit is built around a single narrative arc: what disease is, how it spreads, how the body fights it, how we prevent and treat it, and how society responds. Every concept you have learned fits into this arc somewhere. Pathogens and transmission explain the cause and spread. The three lines of defence explain the biological response. Vaccines and antibiotics explain prevention and treatment. Public health and epidemiology explain the population-level response.
The connections between concepts are just as important as the concepts themselves. Vaccination coverage determines herd immunity. Antibiotic misuse drives resistance through natural selection. Social determinants shape health outcomes across populations. Global connectivity determines pandemic potential. A student who can trace these connections has mastered the unit; a student who knows only isolated facts has not.
To explain why measles outbreaks occur in wealthy countries with strong healthcare, a synthesising student connects: imported case (global travel) + low local coverage (vaccine hesitancy) + high R₀ (pathogen trait) = outbreak. No single factor explains it; the interaction does.
The Australian Curriculum Assessment and Reporting Authority (ACARA) identifies systems thinking as a key capability in science, recognising that modern challenges like pandemics and climate change require understanding connections, not just facts.
- Vaccination
- Antibiotic overuse
- Social determinants
- R₀ (basic reproduction number)
- Herd immunity
- Health disparities
- Antimicrobial resistance
- Herd immunity threshold
The mathematics of herd immunity is elegant and unforgiving. The threshold formula, 1 minus 1/R₀, means that every increase in contagiousness demands a proportional increase in immunity coverage. A disease with R₀ = 2 needs 50% coverage. R₀ = 4 needs 75%. R₀ = 10 needs 90%. R₀ = 15 (measles) needs roughly 93%. There is no negotiating with these numbers, they are determined by the biology of the pathogen and the mathematics of network spread.
Small drops in coverage create disproportionately large risks for highly contagious diseases. Dropping from 95% to 90% coverage for measles does not increase risk by 5%; it can increase outbreak probability by orders of magnitude because the disease is so contagious that every susceptible person becomes a transmission hub. This nonlinear relationship surprises many people but is fundamental to epidemic dynamics.
Measles R₀ ≈ 15, threshold ≈ 93%. If coverage is 94%, outbreaks are extremely rare. If coverage drops to 90%, imported cases regularly spark outbreaks. The 4% drop creates a massive change in risk because measles spreads so efficiently.
NCIRS modelling shows that even a 2-3% drop in measles vaccination coverage in a single Australian postcode can shift the area from protected to vulnerable, triggering targeted public-health campaigns to restore coverage before an outbreak occurs.
A fair method is the backbone of any scientific investigation. Fairness means that the only thing differing between your experimental groups is the independent variable you are testing. If you are testing whether temperature affects bacterial growth, then temperature is the only thing that should change. Everything else, type of bacteria, amount of nutrient, container size, light exposure, incubation time, must be identical across all groups. These unchanged factors are called controlled variables.
Reliability means your results are consistent and repeatable. You achieve reliability by using multiple replicates, several identical trials at each condition, and by measuring precisely. A single petri dish at each temperature tells you almost nothing, because the result might be a fluke. Three or more replicates let you see whether a pattern is real or random. Precise measurements (using a ruler with millimetre marks rather than eyeballing) reduce uncertainty and strengthen your conclusions.
A student tests bacterial growth at 20°C and 37°C using one petri dish per temperature. The 37°C dish shows more growth, but a single trial cannot rule out chance. With five dishes per temperature, the student can calculate an average and see whether the difference is consistent.
The CSIRO Education program provides free resources on experimental design for schools, emphasising that the difference between a demonstration and an experiment is the control of variables.
Wrong: "A depth study is just a long essay about a disease." No, a depth study is an investigation. It requires you to ask a question, gather evidence, analyse data, and draw conclusions. It is active science, not just research.
Right: A depth study is an active scientific investigation that requires asking a question, gathering evidence, analysing data, and drawing conclusions. It is not just a research essay.
Wrong: "The different topics in this unit have no connection to each other." No, they are deeply connected. Pathogens cause disease, which the immune system fights, which vaccines train, which antibiotics treat, which resistance limits, which public health prevents. Every topic links to others.
Right: All topics in this unit are deeply connected: pathogens cause disease, which the immune system fights, which vaccines train, which antibiotics treat, which resistance limits, which public health prevents.
Wrong: "Once you memorise facts about disease, you understand it." No, true understanding means being able to explain connections, apply concepts to new situations, and evaluate evidence. Facts are tools; understanding is the ability to use them.
Right: True understanding means being able to explain connections between concepts, apply them to new situations, and evaluate evidence. Facts alone are not enough without the ability to use them.
Australian Scientists Fighting Disease
Professor Fiona Stanley (AC): An Australian epidemiologist who founded the Telethon Kids Institute in Perth. Her research on birth defects, Indigenous health, and population health methods transformed Australian public health. She championed the use of population data to guide health policy.
Professor Ian Frazer: Co-developer of the HPV vaccine at the University of Queensland. His work has prevented countless cases of cervical cancer worldwide and put Australia on track to eliminate cervical cancer entirely.
Modern Australian research: Today, Australian scientists at WEHI, the Doherty Institute, CSIRO, and universities across the country continue to fight disease. During COVID-19, Australian researchers contributed to vaccine development, genomic surveillance, and long COVID research. Aboriginal and Torres Strait Islander researchers are increasingly leading health research that addresses community priorities with cultural authority.
✍ Copy Into Your Books
▾Unit Connections
- Pathogen -> Transmission -> Defence -> Treatment
- Infectious vs non-infectious disease
- Local, national, and global perspectives
Key Formulas
- Herd immunity threshold ≈ 1 - 1/R0
- Incidence rate = (new cases/population) × multiplier
- Case fatality rate = (deaths/cases) × 100%
Depth Study Steps
- Choose topic -> Formulate question -> Research -> Hypothesis -> Method -> Data collection -> Analysis -> Conclusions -> Communication
Concept Connections
Depth Study Planning
At the start of this lesson, you considered how NSW Health traced a measles outbreak in western Sydney back to a single unvaccinated traveller, connecting vaccination records, hospital data, and contact maps to understand how multiple layers of disease prevention work together.
Now that you've worked through the lesson, can you describe how handwashing, antibiotics, and vaccines each contribute a different layer of protection? What do you think happens to the whole system when just one of those layers breaks down?
Q1. Define epidemiology and explain the difference between incidence and prevalence, using an example. (2 marks)
Q2. During the 2019 Sydney measles outbreak, NSW Health combined three data streams (vaccination records, hospital admissions, and contact-tracing maps). Explain why using several data streams together is more reliable than relying on just one. (3 marks)
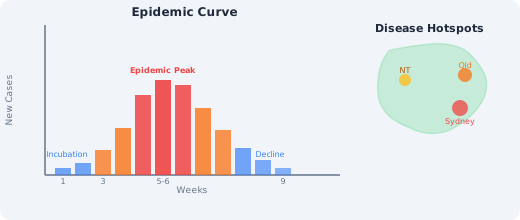
Q3. An epidemiologist is given a graph showing new measles cases each week. Describe the steps you would take to interpret the epidemic curve and decide whether the outbreak is growing or slowing. (3 marks)
Revisit Your Thinking
Go back to your Think First answer. Has your understanding changed?
- How has your understanding of disease and health developed across this entire unit?
- What connections between concepts do you find most powerful or surprising?
Model answers (click to reveal)
Answers
▾MCQ 1
B Epidemiology is the study of how diseases spread through populations and the factors that influence how often they occur. It looks at patterns across groups of people, not the treatment of a single patient.
MCQ 2
A The index case is the first known person to catch the disease in an outbreak. Tracing back to the index case helps investigators find the source and map how the disease spread.
MCQ 3
C The peak of an epidemic curve is the point where the largest number of new cases was recorded in a single period. After the peak, the number of new cases usually declines.
MCQ 4
D Contact tracing identifies and follows up the people an infected person has been near, so they can be tested or isolated before they spread the disease further.
MCQ 5
B Incidence is the number of new cases appearing over a set period of time. Prevalence is the total proportion of a population that has the disease at one point in time.
Short Answer 1
Model answer: Epidemiology is the study of how diseases spread through populations and the factors that influence how often they occur. Incidence counts the number of new cases of a disease that appear in a population over a set period, for example 40 new measles cases in Sydney during one month. Prevalence is the total proportion of the population that has the disease at a given moment, for example all the people currently infected with measles on a single day. Incidence measures how fast new cases are appearing, while prevalence measures how widespread the disease is at one point in time.
Short Answer 2
Model answer: Using several data streams together is more reliable because any single source can be incomplete or misleading. Vaccination records show who was unprotected but not who actually became sick. Hospital admissions show severe cases but miss mild ones treated at home. Contact-tracing maps show who was exposed but rely on people remembering their movements. By combining all three, investigators can cross-check the information: gaps in one stream are filled by another, false leads are ruled out, and the true source and spread of the outbreak can be located with much greater confidence. In 2019 this allowed NSW Health to trace the outbreak back to a single unvaccinated traveller and stop transmission within two weeks.
Short Answer 3
Model answer: First, read the axes carefully: the horizontal axis usually shows time (weeks) and the vertical axis shows the number of new cases. Second, identify the overall shape, noting where cases first rise, where the peak (highest bar) occurs, and whether the curve falls again afterwards. Third, compare the most recent bars with earlier ones: if the number of new cases each week is still rising, the outbreak is growing; if the bars are getting shorter week by week, the outbreak is slowing. Finally, link the trend to the public-health response, since a falling curve after contact tracing and vaccination suggests the control measures are working.