What Is Infectious Disease?
On 11 March 2020, WHO declared SARS-CoV-2 a pandemic, the first since 2009. Within six months, 11 million confirmed cases had been reported in 188 countries, and the virus's genome (29,903 base pairs) had been sequenced within 10 days of the first case. Understanding why infectious disease spreads so fast means knowing exactly what a pathogen is, what it does, and how it moves between hosts.
Orient yourself
Make a prediction, scan the goals and vocabulary, then begin with a clear mental model.
Practise this lesson
Four printable worksheets that build from the foundations up to exam-style questions, start at whatever level suits you.
Here is a statement many people believe:
"All microorganisms cause disease, they are harmful by nature."
Do you agree or disagree? Write your reasoning. If you agree, explain why. If you disagree, give a specific example that challenges this claim. You will return to this at the end of the lesson.
Know
- The definition of infectious disease and pathogen
- The three categories of pathogen: microorganisms, macroorganisms, non-cellular
- Examples of each category causing disease in plants and animals
- How disease transmission data is collected
- The definitions and formulas for incidence and prevalence of infectious disease
Understand
- Why classifying pathogens matters for treatment and prevention
- How infectious disease differs from non-infectious disease
- Why most microorganisms are not pathogens
- Why incidence and prevalence describe different aspects of a disease's impact on a population
Can Do
- Classify a given pathogen into the correct category
- Describe how data on disease transmission is collected
- Distinguish infectious from non-infectious disease with examples
- Calculate and interpret incidence and prevalence data, including the effect of population mobility and immunity
Define and classify pathogens
Separate infectious from non-infectious disease, then organise pathogens into the three major groups.
Core Content
Pathogens vs lifestyle, genetic and environmental causes
In 1854, London's Broad Street residents were dying of cholera at a rate of 127 per week. In 1918, a soldier sneezed in a Kansas army barracks and within months 50 million people were dead. In 2020, a single novel coronavirus brought global aviation to a halt in weeks. In every case, the cause was a pathogen, a specific, identifiable agent capable of entering a host, replicating, and causing harm.
An infectious disease is a disease caused by a pathogen, an organism or agent that enters a host and causes harm. This distinguishes it from non-infectious diseases (cancer, heart disease, type 1 diabetes), which arise from genetic, environmental or lifestyle factors rather than an invading organism.

Infectious vs Non-Infectious Disease
Pause, copy the highlighted definitions of infectious vs non-infectious disease into your book.
Which of the following is an infectious disease?
Microorganisms · macroorganisms · non-cellular agents
We just saw that infectious disease is caused by pathogens. That raises a question: are all pathogens the same kind of thing? This card answers it → they fall into three groups, and the group decides how the disease is diagnosed and treated.
Pathogens are sorted into three broad groups by their biological nature, and the group a pathogen belongs to decides how the disease can be diagnosed and treated.
This classification matters because each category requires different diagnostic and treatment strategies.
Microorganisms
Microscopic living organisms. Treated as living cells, can reproduce independently (bacteria) or within a host cell (some).
- Bacteria: Tuberculosis, golden staph, salmonella
- Fungi: Tinea, candidiasis, aspergillosis
- Protozoa: Malaria (Plasmodium), giardia, toxoplasma
Macroorganisms
Visible parasites. Large enough to see with the naked eye at some life stages.
- Helminths (worms): Tapeworms, roundworms, flukes
- Ectoparasites: Lice, ticks, mites, fleas
Cause disease through physical damage, nutrient competition, and immune activation.
Non-Cellular Pathogens
Not living cells, cannot independently metabolise or reproduce. Require a host.
- Viruses: COVID-19, influenza, HIV, HPV, measles
- Prions: Misfolded proteins, BSE (mad cow disease), CJD
- Viroids: Small RNA molecules, plant pathogens only
Three pathogen groups: microorganisms (bacteria, fungi, protozoa, living cells); macroorganisms (helminths, ectoparasites, visible parasites); non-cellular (viruses, prions, viroids). Antibiotics work on bacteria only, not viruses, fungi or prions.
Pause, copy the three pathogen groups and the antibiotics point into your book.
A prion (e.g. the agent of CJD) is best classified as a:
Pathogen Classification Diagram
Pattern A, Draw and Annotate
In your book, construct a classification diagram (branching tree) for pathogens. Your diagram must:
- Show the three main categories (microorganisms, macroorganisms, non-cellular pathogens) as branches from a central 'Pathogen' node.
- Include at least two sub-categories under each main category (e.g. bacteria and fungi under microorganisms).
- Label one specific named example of a disease-causing organism at the end of each branch.
- For three of your examples, add a short annotation (one sentence) explaining why that pathogen fits in that category, not just naming it.
Connect hosts and transmission
Compare plant and animal examples, then examine how scientists collect transmission data.
The same pathogen types attack both kingdoms
We just saw the three pathogen groups. That raises a question: do the same pathogens attack plants and animals? This card answers it → both kingdoms are hit by the same types, with two key exceptions.
Pathogens infect both plants and animals, but the organisms involved and the way they cause disease differ between the two kingdoms.
The HSC requires you to be able to classify pathogens causing disease in both groups.
| Pathogen Type | Plant Example | Animal/Human Example |
|---|---|---|
| Bacterium | Crown gall disease (Agrobacterium tumefaciens) | Tuberculosis (Mycobacterium tuberculosis) |
| Virus | Tobacco mosaic virus (TMV) | COVID-19 (SARS-CoV-2) |
| Fungus | Wheat stem rust (Puccinia graminis) | Tinea (Trichophyton spp.) |
| Protozoan | Pythium root rot (Oomycete, fungus-like protist) | Malaria (Plasmodium falciparum) |
| Helminth | Root-knot nematodes (Meloidogyne spp.) | Tapeworm (Taenia solium) |
| Viroid | Potato spindle tuber viroid (PSTVd) | Not known to infect animals |
| Prion | Not known to infect plants | BSE (bovine spongiform encephalopathy) |
The same pathogen types (bacteria, viruses, fungi, protozoa, helminths) infect both plants and animals, except viroids, which infect plants only, and prions, which infect animals only.
Pause, copy the plant vs animal pathogen rule and its two exceptions into your book.
Viroids are known to infect both plants and animals.
An infectious disease is caused by a pathogen that can be transmitted from one organism to another.
All diseases caused by microorganisms are infectious diseases.

The disease process: from pathogen exposure through infection, incubation, symptoms and final outcome. Understanding each stage is essential for designing interventions.
How epidemiologists map the spread of disease
We just saw which pathogens cause disease. That raises a question: how do scientists actually track how a disease spreads? This card answers it → epidemiologists collect both primary and secondary data on transmission.
Understanding how a disease spreads requires systematic data collection, and epidemiologists draw on both data they gather themselves and data gathered by others.
Epidemiologists, scientists who study disease patterns in populations, use several methods to collect primary and secondary data on transmission.
| Method | Type | What It Reveals | Example |
|---|---|---|---|
| Contact tracing | Primary | Who infected whom; transmission chains | COVID-19 app data tracking spread through workplaces |
| Case reporting | Primary | Incidence (new cases) over time and location | Notifiable disease registers (e.g. tuberculosis, meningococcal) |
| Serology surveys | Primary | Who has been exposed (has antibodies) vs who is susceptible | COVID-19 seroprevalence studies to estimate true infection rate |
| Historical records | Secondary | Patterns over time; epidemic curves | Death records used to reconstruct the 1918 influenza pandemic |
| Published research | Secondary | Mechanism of transmission; risk factors | WHO and CDC disease surveillance reports |

Data Collection Methods, Primary vs Secondary
Primary data is collected directly by the investigator (contact tracing, case reporting, serology surveys). Secondary data is collected by someone else and reused (historical records, published research, WHO/CDC surveillance). Epidemiologists use both to map transmission.
Pause, copy the primary vs secondary data distinction (with examples) into your book.
Data the investigator collects directly, such as swabbing patients or interviewing contacts, is called _____ data.
Analysing COVID-19 Transmission Data
Pattern A, Structured Data Analysis
The table below shows COVID-19 transmission data collected during the first wave in Australia (March–May 2020).
- Identify which transmission setting was responsible for the greatest proportion of cases. Suggest one reason why this setting was the most common source.
- Classify each data collection method listed in the table as either primary or secondary data. Justify your classification for one example.
- The 'community (unknown source)' category accounts for 19% of cases. Explain what this suggests about the limitations of contact tracing as a method of collecting transmission data.
- Suggest one additional data collection method that could have been used to better understand the 'community' transmission group. Explain what information it would provide.
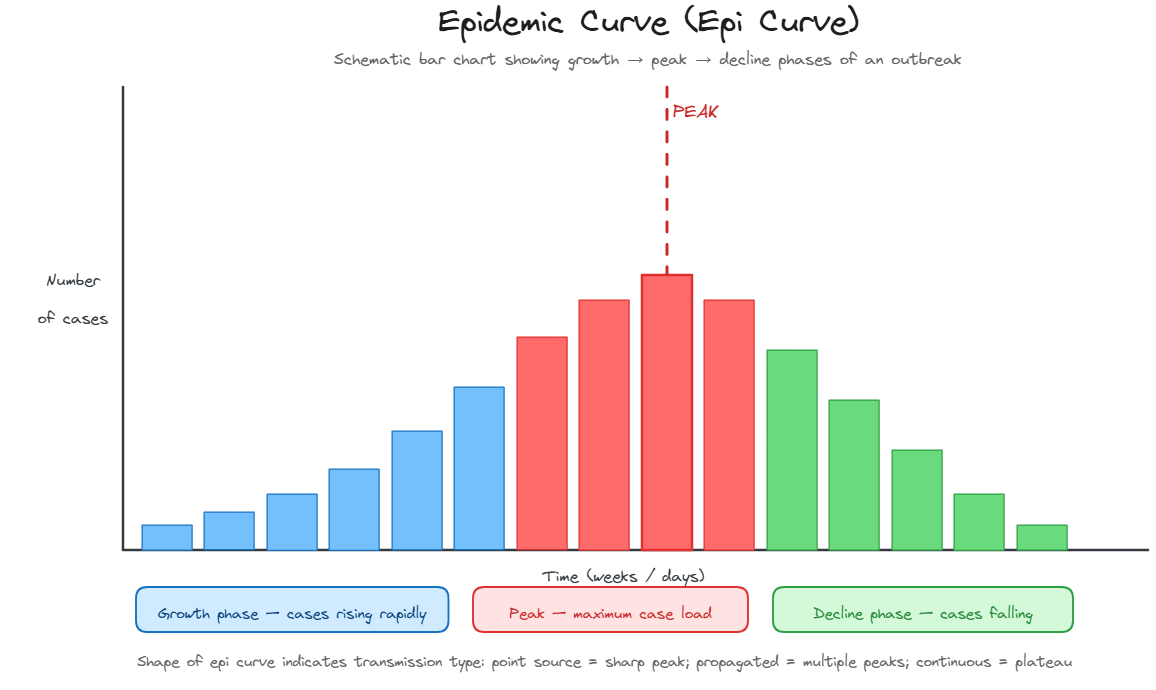
Epidemic Curve, COVID-19 Schematic
Interpret disease data
Calculate incidence and prevalence, then consolidate the model with a real outbreak.
Two different measures of how big a disease problem really is
We just saw how epidemiologists collect transmission data, and the epidemic curve above shows how new COVID-19 cases changed week by week. That raises a question: once that data is collected, how is it turned into a single number that describes a disease's impact on a population? This card answers it → two related but distinct measures, incidence and prevalence.
A health department reporting "4,000 new malaria cases this year" and a survey team reporting "15,000 people currently carrying the malaria parasite" are describing the same outbreak with two completely different measures, and confusing the two leads to serious misreading of how well a disease is actually being controlled.
Incidence is the number of new cases of a disease that arise in a population during a defined time period, usually expressed as a rate per head of population. It answers the question, how fast is this disease spreading right now?
Prevalence is the total number of existing cases of a disease in a population at a given point in time, regardless of when each case first appeared. It answers a different question, how much of this disease is out there right now?
Because prevalence counts every case still present, old and new, a disease that people carry for a long time, a chronic infection or one with long-lasting asymptomatic carriage, can show a much higher prevalence than its incidence alone would suggest.
| Feature | Incidence | Prevalence |
|---|---|---|
| Counts | Only new cases diagnosed in a set time period | All existing cases at one point in time |
| Tells you | How fast a disease is spreading or developing | How much of the population is currently affected |
| Best for | Judging whether transmission-control measures are working | Planning how many hospital beds, staff or drug supplies a region needs |
| Typical data source | Case reporting, notifiable disease registers | Cross-sectional surveys, serology or parasite-screening surveys |
A province in South East Asia has a population of 500,000. Over one calendar year, the regional health department's case-reporting register recorded 4,000 new, symptomatic malaria diagnoses.
Step 1, incidence rate: Incidence = (4,000 ÷ 500,000) × 1,000 = 8 new cases per 1,000 people per year.
Midway through the same year, a cross-sectional blood-screening survey tested a representative sample across the province and estimated that 15,000 people were carrying the malaria parasite at that time, including people with no symptoms.
Step 2, point prevalence: Prevalence = (15,000 ÷ 500,000) × 100 = 3% of the population.
Step 3, interpretation: Prevalence, 15,000 carriers, is far higher than the 4,000 people diagnosed that year. In a malaria-endemic region, repeated exposure builds partial immunity, so many long-term residents carry the parasite without developing symptoms severe enough to seek diagnosis. These asymptomatic carriers are missed by case reporting, which only counts diagnosed, symptomatic cases, but they still show up in a prevalence survey, and they remain a reservoir that mosquitoes can pick up and pass on.
Population mobility changes this picture further. During the harvest season, thousands of seasonal workers migrate into the province from regions with little or no malaria transmission. Because these workers lack the partial immunity built up by lifelong residents, a much higher proportion of them develop symptomatic disease when bitten, so incidence, newly diagnosed cases, spikes sharply during harvest season even though the underlying prevalence of the parasite in long-term residents has not changed. A bed-net or vaccination program that raises the proportion of the population that is immune or immunised would be expected to lower incidence over time, without necessarily eliminating prevalence immediately, since existing carriers remain infected until they clear the parasite.
Incidence = new cases ÷ population at risk, a rate, over a time period. Prevalence = all existing cases ÷ total population, a snapshot, at one point in time. A disease can show high prevalence but comparatively lower incidence if carriers remain infected for a long time or are asymptomatic, as with malaria in endemic populations. Mobility of non-immune people into a region raises incidence, while rising population immunity or immunisation lowers it.
Pause, copy the incidence and prevalence formulas and the worked malaria example into your book.
A town of 40,000 people records 120 new cases of a disease in one year. What is the incidence rate per 1,000 people?
SARS-CoV-2, the virus causing COVID-19, is a non-cellular pathogen: a single-stranded RNA virus approximately 100 nm in diameter, roughly 1000 times smaller than the width of a human hair. When it emerged in late 2019, contact tracing teams in Wuhan rapidly collected primary transmission data by interviewing patients and mapping cases to common locations, identifying the Huanan Seafood Market as an early cluster. Within weeks, secondary data from published genomic analyses confirmed human-to-human transmission was occurring. By March 2020, the WHO declared a global pandemic, the first since the 2009 H1N1 influenza outbreak. The speed at which SARS-CoV-2 spread globally illustrates why correctly classifying a pathogen and understanding its transmission route is not an academic exercise, it directly determines the response. You will use COVID-19 data in Activity 2 and Short Answer Q3.
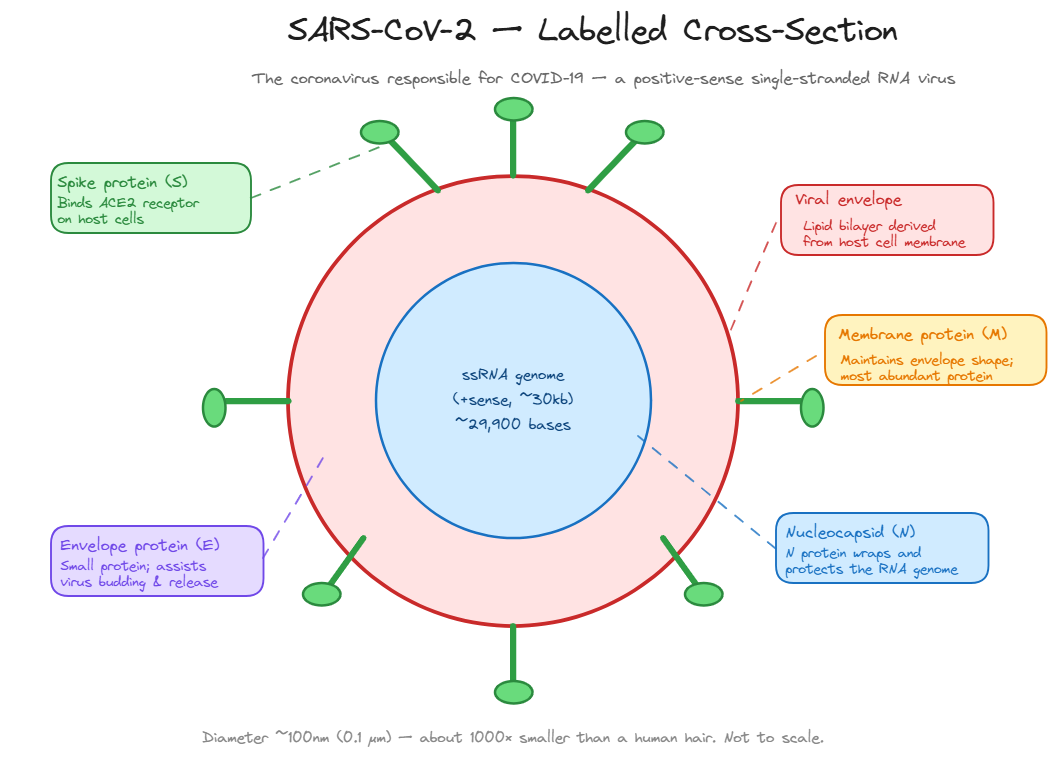
SARS-CoV-2 Labelled Structure
Infectious vs Non-Infectious
- Infectious disease: caused by a pathogen, can be transmitted between hosts.
- Non-infectious disease: caused by genetic, lifestyle, or environmental factors, not transmissible.
- Pathogen: any organism or agent that invades a host and causes disease.
- Examples: COVID-19 (infectious); type 2 diabetes (non-infectious).
Pathogen Categories
- Microorganisms: bacteria, fungi, protozoa, living cells.
- Macroorganisms: helminths (worms), ectoparasites (lice, ticks), visible parasites.
- Non-cellular: viruses (DNA/RNA + protein coat), prions (misfolded proteins), viroids (RNA, plants only).
- Viruses are NOT living cells, they cannot reproduce independently.
Pathogens in Plants and Animals
- Both kingdoms affected by bacteria, viruses, fungi, protozoa, helminths.
- Viroids: plant pathogens only (e.g. potato spindle tuber viroid).
- Prions: animal pathogens only (e.g. BSE, mad cow disease).
- Classification matters: determines treatment approach.
Collecting Transmission Data
- Primary: contact tracing, case reporting, serology surveys (collected directly).
- Secondary: historical records, published research, WHO/CDC surveillance.
- Epidemiologists use both types to map transmission patterns and epidemic curves.
- Data collection drives the public health response to outbreaks.
Incidence & Prevalence
- Incidence: new cases ÷ population at risk × 1,000 (or 100,000), over a time period.
- Prevalence: existing cases ÷ total population × 100, at one point in time.
- High prevalence with lower incidence can signal long-lasting or asymptomatic infection (e.g. malaria carriers).
- Mobility of non-immune people raises incidence; rising population immunity/immunisation lowers it.
Practise independently
Attempt at least one response in your own words. Model answers support checking; they do not replace the attempt.
A fresh set drawn from this lesson's question bank, feedback shown immediately. +5 XP per correct · +25 XP all correct
Pick your answer, then rate your confidence, that tells the system what to drill next.
UnderstandBand 3(3 marks) 1. Distinguish between infectious and non-infectious disease. In your answer, refer to the role of pathogens and give one example of each type of disease.
1 mark: definition of infectious disease referencing pathogens and transmission · 1 mark: definition/description of non-infectious disease · 1 mark: one correct example of each
ApplyBand 3(3 marks) 2. Classify the following pathogens into the correct category and provide a reason for each classification: (a) influenza virus, (b) Plasmodium falciparum, (c) the prion causing CJD.
1 mark per correct classification with reason
EvaluateBand 5(4 marks) 3. Evaluate the usefulness of contact tracing as a method for collecting data on COVID-19 transmission. In your answer, describe what contact tracing involves, identify one strength and one limitation of this method, and explain how a second data collection method could be used to address the limitation.
1 mark: description of contact tracing · 1 mark: identified strength with reasoning · 1 mark: identified limitation · 1 mark: second method logically addresses the limitation
Show all answers
Multiple choice
MC answers and full explanations are shown inline as you complete each question. Use the retry button to attempt a fresh set from the lesson bank.
Short Answer Model Answers
Q1 (3 marks): An infectious disease is caused by a pathogen, an organism or agent that invades a host and causes harm, and can be transmitted between hosts, either directly or indirectly. For example, COVID-19 is an infectious disease caused by the SARS-CoV-2 virus, which spreads via respiratory droplets. A non-infectious disease is not caused by a pathogen and cannot be transmitted from person to person; it arises from genetic, lifestyle, or environmental factors. For example, type 2 diabetes is a non-infectious disease caused by lifestyle factors including diet and physical activity, combined with genetic predisposition.
Q2 (3 marks): (a) Influenza virus: non-cellular pathogen. A virus consists only of genetic material (RNA in this case) enclosed in a protein coat. It has no cell membrane, cannot metabolise, and can only replicate inside a host cell, it is not a living cell. (b) Plasmodium falciparum: microorganism (specifically a protozoan). It is a single-celled eukaryotic organism that can carry out all life processes independently and reproduces inside red blood cells. (c) The prion causing CJD: non-cellular pathogen. A prion is a misfolded protein, it contains no nucleic acid and is not a living organism. It causes disease by inducing normal cellular proteins to misfold, but it has no cellular structure whatsoever.
Q3 (4 marks): Contact tracing involves interviewing diagnosed patients to identify people they came into contact with during their infectious period, then notifying and testing those contacts to interrupt transmission chains. A strength is that it provides specific, direct data on transmission routes and settings, for example, confirming whether disease is spreading through households, workplaces, or healthcare settings. A limitation is that contacts can only be identified if the patient recalls them; community transmission from brief or anonymous encounters (e.g. public transport) cannot be traced, leading to unknown-source cases. This limitation could be addressed by serology surveys, testing a population sample for antibodies to estimate how many people have been exposed, even without known contact histories. This provides population-level exposure data even where individual chains cannot be reconstructed.
Retrieve and reflect
Use the Review session first, then compare how your thinking changed.
A full module quiz covering every lesson in this module, not just this one. Set aside a decent block of time and treat it like a real assessment.
Start the module quiz →You were asked what makes a pathogen capable of spreading to 11 million people in 188 countries in six months, as WHO Director-General Tedros Adhanom Ghebreyesus reported when declaring SARS-CoV-2 a pandemic on 11 March 2020.
The WHO pandemic declaration made three things explicit: the virus was a specific transmissible agent (not bad air or chance); it crossed international borders because humans are the host; and its 29,903-base-pair genome could be sequenced and shared within 10 days because it was a definable biological entity. That is precisely what this lesson's definition of a pathogen captures, an organism or agent that enters a host and causes harm through a defined biological mechanism.
The human body hosts approximately 38 trillion bacterial cells, most are essential symbionts. Scientists have identified around 1,400 species of bacteria known to cause disease out of an estimated one trillion bacterial species on Earth. Pathogenicity is a specific, relatively rare characteristic, not a defining feature of all microscopic life. SARS-CoV-2 was one agent in 2020; recognising exactly what it was allowed the world to respond with targeted vaccines rather than generic treatments.
If you connected the speed of spread to transmission mode and host susceptibility, you were thinking about the right variables.