Modes of Transmission
In September 1854, John Snow mapped 616 cholera deaths in Soho, London over 10 days and traced them to the Broad Street water pump, before germ theory was proven, before the causative bacterium was identified. He petitioned the Vestry of St James to remove the pump handle. Deaths stopped within three days. The Lancet ridiculed his method in 1855; he is now considered the founder of modern epidemiology. His map is still used in textbooks today.
Practise this lesson
Four printable worksheets that build from the foundations up to exam-style questions, start at whatever level suits you.
Imagine a gastroenteritis outbreak at a school camp. Within 48 hours, 34 of 60 students become ill with vomiting and diarrhoea. The symptoms appear in two distinct clusters, one group became ill on Tuesday evening, another on Wednesday morning.
Before reading on: what does the two-cluster pattern suggest about how this disease was transmitted? Write down the transmission route you suspect and the evidence from the scenario that supports it.
Know
- The three modes of transmission: direct contact, indirect contact, vector
- Examples of diseases transmitted by each mode
- How epidemiologists investigate transmission during an epidemic
- What an epidemic curve shows and how to interpret one
Understand
- Why the transmission route determines the public health response
- How John Snow's method established epidemiology as a science
- Why some diseases spread faster than others based on transmission mode
Can Do
- Classify a disease's transmission route with justification
- Interpret an epidemic curve to identify the likely transmission pattern
- Describe how data is collected to trace transmission during an epidemic
Core Content
Direct contact · indirect contact · vector
In September 1854, John Snow plotted 616 cholera deaths on a street map of Soho, London. The dots clustered around one point, the Broad Street water pump. People using a different pump 200 metres away were not dying. The geographic pattern told him the transmission route before any laboratory analysis was possible: cholera was travelling through water, not air.
Every infectious disease must move from one host to another to persist in a population. There are three main modes of transmission.
Direct Contact
The pathogen passes directly from one host to another with no intermediate object or organism involved.
- Skin-to-skin: tinea, impetigo, scabies
- Respiratory droplets: influenza, COVID-19, whooping cough (close contact, droplets >5 µm)
- Sexual contact: HIV, gonorrhoea, syphilis, HPV
- Blood-to-blood: HIV, hepatitis B/C (needle sharing, transfusion)
- Mother to child: HIV, rubella, cytomegalovirus (vertical transmission)
Indirect Contact
The pathogen passes via an intermediate, a contaminated object (fomite), food, water, or airborne particles, rather than directly between hosts.
- Fomites (contaminated surfaces): influenza (door handles), norovirus (surfaces)
- Contaminated water: cholera, typhoid, giardia
- Contaminated food: salmonella, E. coli O157, listeria
- Airborne (droplet nuclei <5 µm): tuberculosis, measles, chickenpox
- Soil: tetanus (Clostridium tetani spores), hookworm larvae
Vector Transmission
The pathogen is carried and transmitted by a living organism (the vector), usually an arthropod such as a mosquito, tick, or flea.
- Mosquito: malaria (Plasmodium via Anopheles), dengue fever, Ross River virus, Zika virus
- Tick: Lyme disease, spotted fever
- Flea: bubonic plague (Yersinia pestis)
- Sandfly: leishmaniasis
Biological vs mechanical vector: a biological vector (e.g. mosquito) is part of the pathogen's life cycle; a mechanical vector (e.g. housefly carrying bacteria on its legs) is not.
Three modes of transmission: direct contact (host-to-host, droplets >5 µm, sexual, blood, vertical); indirect contact (via fomite, water, food, soil or airborne particles <5 µm); and vector (a living organism such as a mosquito carries the pathogen). Control depends on the mode, isolation vs sanitation vs vector elimination.
Pause, copy the three modes of transmission and a control measure for each into your book.
Malaria, transmitted by the Anopheles mosquito, is an example of which mode of transmission?
Transmission Mode Diagram
Pattern A, Draw and Annotate
In your book, draw a diagram showing how each of the three transmission modes works. Your diagram must:
- Show two human figures (or plant figures for one example) with a labelled pathway between them for each transmission mode.
- For direct contact: show one respiratory droplet pathway and one skin-contact pathway, with labels indicating the droplet size range and one named disease for each.
- For indirect contact: show a fomite pathway AND a waterborne pathway, labelling the intermediate object or medium and a named disease for each.
- For vector transmission: show the vector between two hosts, label the vector organism, and name the disease and the pathogen it carries.
- For each of the three modes, add one annotation explaining the key control measure used to interrupt that specific transmission route.

The four main modes of disease transmission and the control strategies that target each route. Breaking any link in the chain stops the spread.
Many diseases travel by more than one route
We just saw the three modes of transmission. That raises a question: how do real diseases map onto them? This card answers it → worked examples, where most diseases turn out to have a primary route and a secondary one.
Understanding every route a disease can take is essential for designing comprehensive control strategies, most diseases have a primary route and a secondary one.
| Disease | Pathogen Type | Primary Route | Secondary Route | Control Implication |
|---|---|---|---|---|
| Cholera | Bacterium (Vibrio cholerae) | Indirect, contaminated water | Indirect, contaminated food | Water treatment and sanitation; no direct person-to-person route in most cases |
| COVID-19 | Virus (SARS-CoV-2) | Direct, respiratory droplets (close contact) | Indirect, airborne aerosols; fomites (less common) | Masks, ventilation, distancing; surface cleaning has limited impact |
| Malaria | Protozoan (Plasmodium) | Vector, Anopheles mosquito | Rare: blood transfusion, vertical | Mosquito nets, insecticides, drainage; person-to-person isolation unhelpful |
| Salmonella | Bacterium | Indirect, contaminated food (poultry, eggs) | Direct, faecal-oral contact | Food safety regulations, cooking temperatures, handwashing |
| HIV | Virus | Direct, blood, sexual contact, vertical | None (not airborne, not waterborne, not via casual contact) | Safe sex, needle programs, antiretroviral treatment to reduce viral load |
| Tuberculosis | Bacterium (M. tuberculosis) | Indirect, airborne droplet nuclei (<5 µm) | None, not via contact or food | Ventilation, negative-pressure rooms, N95 masks; surface disinfection irrelevant |
Cholera = waterborne (indirect); malaria = vector; HIV = direct (blood/sexual/vertical); TB = airborne indirect (<5 µm), so surface cleaning is irrelevant. Many diseases have both a primary and a secondary route, and the control measure must match the actual route(s).
Pause, copy the transmission mode of cholera, malaria, HIV and TB into your book.
Tuberculosis spreads mainly through contaminated food and water.
Biological vectors, such as mosquitoes, are living organisms that transmit pathogens from one host to another.
Fomites are living organisms that transmit infectious diseases directly from person to person.
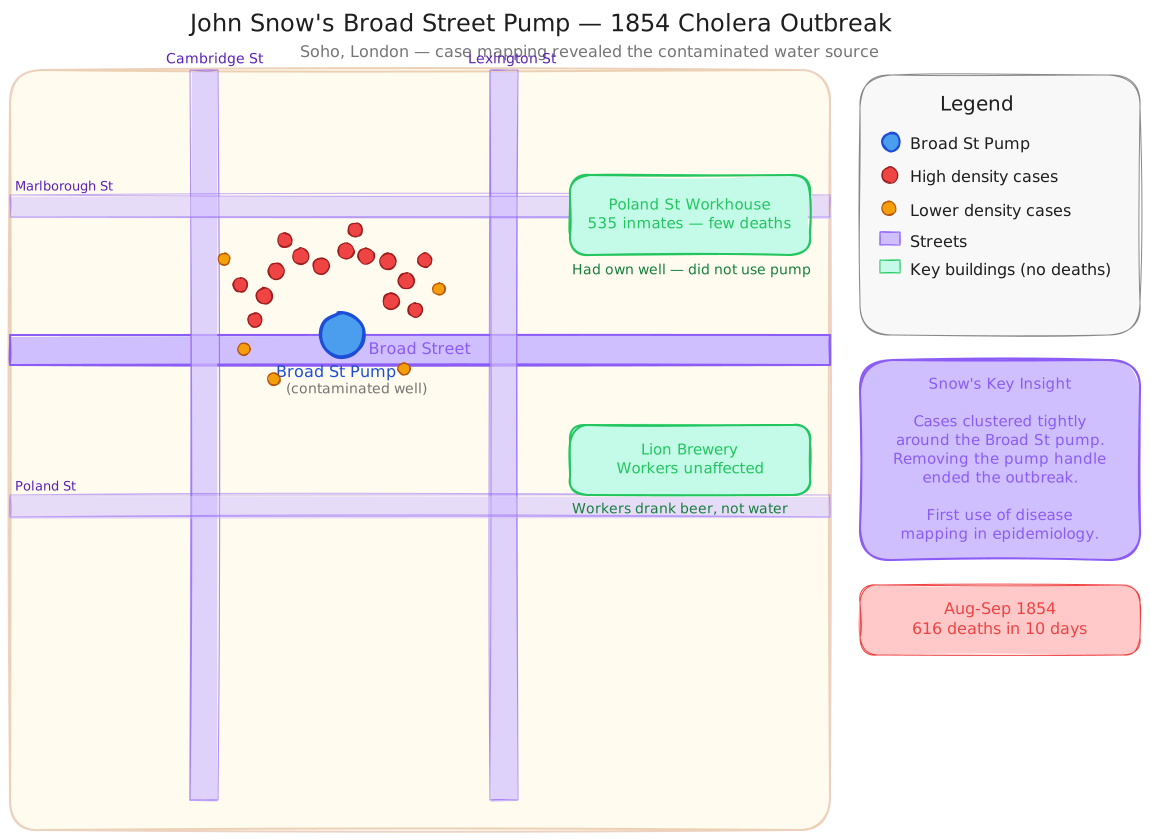
John Snow's Broad Street Pump Map
The epidemiologist's toolkit, from case definition to epi curve
We just saw how to classify the route of a known disease. That raises a question: what do you do with a brand-new outbreak? This card answers it → the systematic steps epidemiologists use to work out how it is spreading.
When a new outbreak begins, epidemiologists must rapidly work out how a disease is spreading, and their method is the same whether it is a school cluster or a global pandemic.
Reading an Epidemic Curve
The shape of an epidemic curve reveals the likely transmission mode before laboratory results are available.
Point source
Continuous common source
Propagated
Three epidemic curve patterns, point source (single sharp peak), continuous common source (sustained plateau), propagated (successive waves of increasing size)
Outbreak investigation steps: define a case → find cases → plot the epidemic curve → map the source → intervene. Curve shapes: point source = one sharp peak (single exposure); continuous source = a plateau (ongoing contamination); propagated = successive growing waves (person-to-person).
Pause, copy the outbreak steps and the three epidemic-curve shapes into your book.
An epidemic curve with a single sharp peak, all cases within one incubation period, indicates which type of outbreak?
Epidemic Investigation, Gastroenteritis Outbreak at Camp Wollemi
Pattern A, Structured Data Analysis
On Monday morning, 60 Year 10 students arrived at Camp Wollemi for a 3-day outdoor education program. The following data was collected after a gastroenteritis outbreak.
| Day/Time | New Cases | Cumulative Cases | Notes |
|---|---|---|---|
| Monday dinner | 0 | 0 | All students ate chicken pasta from camp kitchen |
| Tuesday 2am–6am | 18 | 18 | Rapid onset vomiting and diarrhoea; fever in 12 |
| Tuesday breakfast | 0 | 18 | Ill students isolated; others ate cereal and toast |
| Tuesday lunch | 0 | 18 | Sandwiches prepared by camp staff |
| Tuesday dinner | 0 | 18 | Different meal; different kitchen staff |
| Wednesday 2am–6am | 16 | 34 | New cluster overnight; these students had eaten Tuesday lunch |
| Wednesday onwards | 0 | 34 | No further cases after Tuesday lunch sandwiches removed from diet |
- Draw a simple epidemic curve using the data above (date/time on x-axis, new cases on y-axis). What type of epidemic curve does this represent? Justify your answer.
- Identify the most likely source of the Tuesday 2am–6am cluster and explain the evidence that supports this conclusion.
- Identify the most likely source of the Wednesday 2am–6am cluster. How does this differ from the Tuesday cluster in terms of the probable mode of transmission?
- The camp director claims the disease must have been spread person-to-person because "it went through two groups." Evaluate this claim using the epidemic data.
- A stool sample from an affected student identified Staphylococcus aureus toxin. How does this information support (or challenge) the conclusion that the outbreak was foodborne?
London, 1854, mapping cases without knowing the pathogen
We just saw the modern outbreak method. That raises a question: could you find a disease's route before germ theory even existed? This card answers it → John Snow and the Broad Street pump, 1854.
Snow identified a waterborne disease and stopped an epidemic without any knowledge of the organism causing it, purely through spatial mapping and careful elimination of alternatives.
In August 1854, a severe cholera outbreak erupted in the Soho district of London. Within three days, 127 people had died on or near Broad Street. Snow, a physician who had long suspected cholera was waterborne, not airborne, began mapping every death by location.
His map revealed a striking pattern: deaths clustered tightly around a single water pump on Broad Street. People who lived closer to other pumps, or who did not drink from the Broad Street pump (including workers at a local brewery who drank only beer), had dramatically lower death rates. One woman who lived far from Broad Street had died, investigation revealed she had water from the pump brought to her specifically because she preferred its taste.
Snow presented his evidence to the local Board of Guardians and persuaded them to remove the handle from the Broad Street pump, disabling it. New cases dropped sharply. The epidemic, which was already declining, ended.
Later investigation revealed that a cesspit containing sewage from a nearby household with a cholera patient was leaking into the ground just centimetres from the pump shaft, contaminating the water supply.
John Snow mapped cholera deaths around the Broad Street pump (Soho, 1854): deaths clustered near the pump, brewery workers who drank beer were spared, and a distant woman who had pump water delivered died. Removing the pump handle cut new cases, identifying the waterborne route without knowing the pathogen, and founding epidemiology.
Pause, copy Snow's evidence and what removing the pump handle showed into your book.
John Snow identified the _____ Street pump as the source of the 1854 Soho cholera outbreak.
Snow's pump handle removal is the most famous intervention in public health history, not because it was dramatic, but because of what it represented. In 1854, the dominant theory of disease was still miasma, cholera was believed to spread through bad air rising from sewage and decomposing matter. Snow's spatial data directly contradicted this: if miasma caused cholera, people throughout Soho should have been equally affected by the bad air. Instead, cases mapped precisely to water source usage. Snow's intervention, removing the pump handle, was an experiment as elegant as Pasteur's swan-neck flask. It had a clear independent variable (access to the contaminated pump), a measurable outcome (case numbers), and it controlled for the miasma explanation by showing that proximity to sewage without drinking the water was not sufficient to cause disease. The method Snow established, disease mapping, source identification, and targeted intervention, is used in every outbreak investigation today, from a gastroenteritis cluster in a school to a global pandemic. You will apply this method in Activity 2 and Short Answer Q3.
Transmission Pathway, Where Interventions Work
Three Modes of Transmission
- Direct contact: pathogen passes directly host-to-host (skin contact, respiratory droplets, sexual contact, blood-to-blood).
- Indirect contact: pathogen passes via fomite, water, food, or airborne particles.
- Vector transmission: living organism (mosquito, tick, flea) carries and transmits pathogen.
Epidemic Curve Shapes
- Point source: single sharp peak, one-time common exposure (e.g. contaminated food).
- Continuous source: sustained plateau, ongoing contamination (e.g. water supply).
- Propagated: successive waves, person-to-person spread (e.g. influenza).
Epidemic Investigation Steps
- 1. Define case (criteria for who counts).
- 2. Find cases (interview, log time/location/contacts).
- 3. Plot epidemic curve (date of onset).
- 4. Map cases to identify common source.
- 5. Intervene, remove source or break transmission chain.
Key Distinctions
- Droplet (>5 µm): direct, short range, influenza, COVID-19.
- Airborne (<5 µm): indirect, long range, TB, measles.
- Biological vector: pathogen completes part of life cycle in vector, malaria in mosquito.
- Fomite: contaminated non-living object, not a vector.
A fresh set drawn from this lesson's question bank, feedback shown immediately. +5 XP per correct · +25 XP all correct
Pick your answer, then rate your confidence, that tells the system what to drill next.
ApplyBand 3(3 marks) 1. Compare direct contact and indirect contact as modes of disease transmission. For each mode, give one named example and explain one control measure that specifically targets that transmission route.
1 mark: direct contact correctly defined with example and control · 1 mark: indirect contact correctly defined with example and control · 1 mark: explicit comparison identifying a key difference between the modes
UnderstandBand 3(3 marks) 2. Describe what an epidemic curve is and explain what can be determined about a disease outbreak from the shape of the curve. In your answer, refer to at least two distinct curve shapes.
1 mark: correct definition of epidemic curve · 1 mark: point source and propagated (or continuous source) shapes correctly described · 1 mark: explanation of what each shape reveals about the transmission pattern
EvaluateBand 5(4 marks) 3. John Snow investigated the 1854 Soho cholera outbreak using spatial mapping of cases. Describe the method he used and the evidence that led him to identify the Broad Street pump as the source. Explain why his investigation was significant despite occurring before the germ theory of disease was established.
1 mark: description of mapping method · 1 mark: specific evidence linking deaths to the pump · 1 mark: significance, identified transmission route without knowing the pathogen · 1 mark: established the core epidemiological method still used today
Show all answers
Multiple choice
MC answers and full explanations are shown inline as you complete each question. Use the retry button to attempt a fresh set from the lesson bank.
Short Answer Model Answers
Q1 (3 marks): Direct contact transmission occurs when the pathogen passes directly from one host to another without an intermediate, for example, influenza spreads via large respiratory droplets (>5 µm) produced when an infected person coughs or sneezes near another person. The key control measure is physical distancing and barrier precautions (masks that filter large droplets), since removing the proximity between hosts interrupts the transmission pathway. Indirect contact transmission occurs when the pathogen passes via an intermediate such as a contaminated object (fomite), food, water, or airborne particle, for example, cholera spreads via water contaminated with Vibrio cholerae. The control measure is water treatment and sanitation, specifically targeting the intermediate (the contaminated water) rather than isolating infected individuals, since the disease does not require direct host-to-host contact. The key difference is whether the pathogen requires physical contact between hosts (direct) or can persist in the environment and reach a new host independently (indirect).
Q2 (3 marks): An epidemic curve is a bar graph that plots the number of new cases of a disease on the y-axis against the date or time of symptom onset on the x-axis. It is used by epidemiologists to visualise the pattern of disease spread over time and identify the probable transmission route. A point source curve shows a rapid rise to a single sharp peak followed by a quick decline, with all cases occurring within approximately one incubation period of each other. This pattern indicates all cases were exposed to the same contaminated source at one point in time, for example, a contaminated food item at a single event. A propagated curve shows a series of successive waves, each larger than the previous one and separated by approximately one incubation period. This pattern indicates person-to-person transmission, where each wave of cases infects the next wave, characteristic of diseases such as influenza spreading through a community.
Q3 (4 marks): Snow mapped each cholera death by its home address onto a street map of Soho, creating a spatial distribution of cases. He then marked the locations of all water pumps in the area. The evidence linking deaths to the Broad Street pump was threefold: first, deaths clustered densely around the pump and thinned with distance toward other pumps. Second, workers at a local brewery, who drank only beer and not pump water, were unaffected despite their proximity to the pump. Third, a woman who lived far from Broad Street had died; investigation revealed her family had the pump's water brought to her specifically because she preferred its taste. Snow presented this spatial evidence to the Board of Guardians and persuaded them to remove the pump handle; new cases ceased. Snow's investigation was significant because he identified the transmission route, waterborne contamination, without any knowledge of the causative organism (Vibrio cholerae was not identified until 1883). He demonstrated that epidemiological evidence alone, collected through systematic observation and spatial analysis, was sufficient to identify and interrupt a transmission chain. His method, case mapping, source identification, hypothesis testing by intervention, established the fundamental methodology of field epidemiology, which remains the primary tool for outbreak investigation today.
Five timed questions on modes of transmission and epidemic curves. Beat the boss to bank a tier, gold (perfect + fast), silver (80%+), or bronze (cleared).
⚔ Enter the arenaClimb platforms, hit checkpoints, and answer quick-recall questions on this lesson. Lighter than the boss, pure recall practice.
You were asked to interpret a gastroenteritis outbreak with two distinct case clusters, one Tuesday morning, one Wednesday morning. This is exactly the kind of epidemiological reasoning John Snow applied in September 1854, when he mapped 616 cholera deaths in Soho, London over 10 days and traced all of them to a single source: the Broad Street pump. Snow's method was spatial and temporal, clustering around one point, not dispersed across the neighbourhood.
The two-cluster pattern in the Camp Wollemi data, with each cluster appearing overnight and roughly 24 hours apart, is the key. If this were person-to-person transmission, you would expect a gradual propagated wave. Instead, two discrete bursts suggest two separate point-source exposures, Monday dinner (chicken pasta) and Tuesday lunch sandwiches. The transmission route was indirect contact via contaminated food, not person-to-person direct contact, just as Snow's 1854 map showed a vehicle route (contaminated water), not person-to-person spread.
If you identified a common-source foodborne route, well done. If you suspected person-to-person spread, the key insight is the timing and discreteness of the clusters, the same reasoning Snow used to remove the Broad Street pump handle before Vibrio cholerae was even identified.